Headlines from Gaza can change by the hour; understanding them shouldn’t require chasing the wind. This article brings the latest developments into one place and frames them with context and data-so you can see not only what is happening, but how it fits into the broader picture.
Here you’ll find concise updates alongside timelines, key actors and milestones, and indicators that track humanitarian, security, and diplomatic dimensions. Where figures or claims diverge, we note the range and the source. When information is provisional, we say so. All entries are time-stamped and regularly revised as new evidence emerges.
Think of this as a compass rather than a conclusion: a guide to the moving parts, the patterns beneath the news, and the questions that still need answers.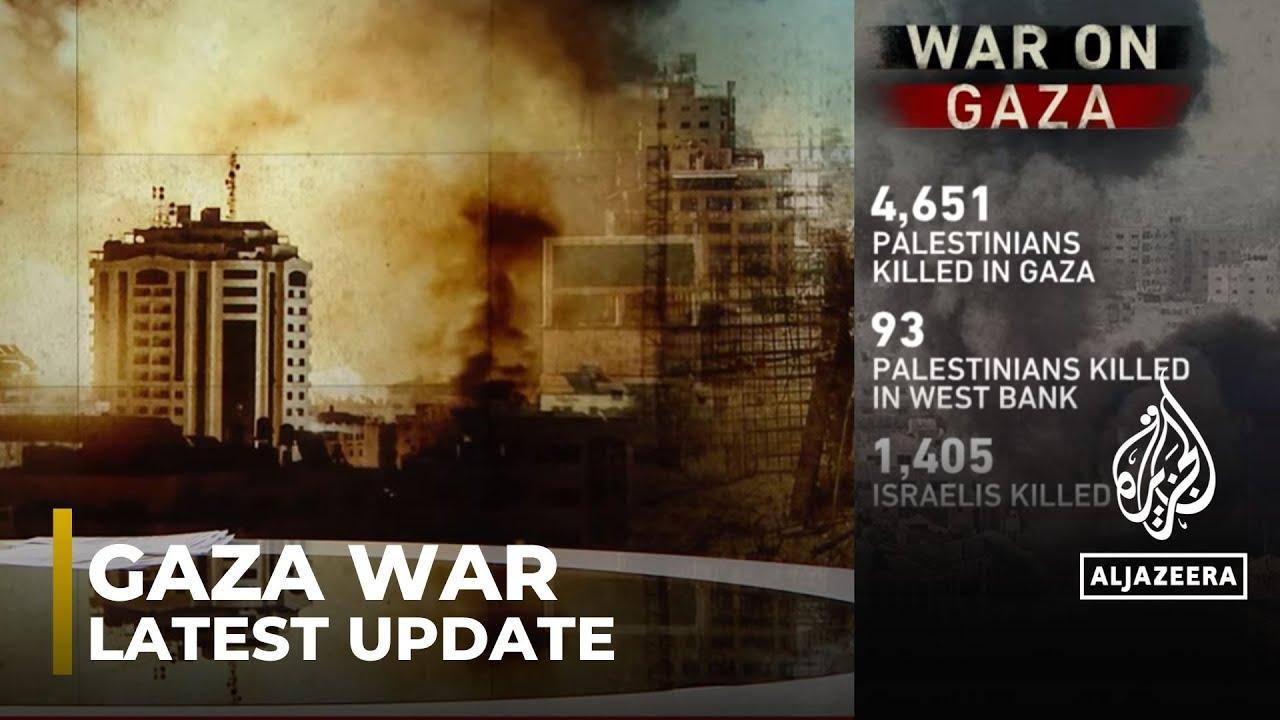
Latest developments and verified timelines from multiple sources
Compiled from open briefings and humanitarian dashboards with corroboration across at least two independent outlets, this snapshot focuses on points of alignment while clearly separating unsettled details. Verification leans on timestamped communiqués, geolocated media, and official notices; when certainty drops, items are deferred rather than speculated. Current threads of agreement include:
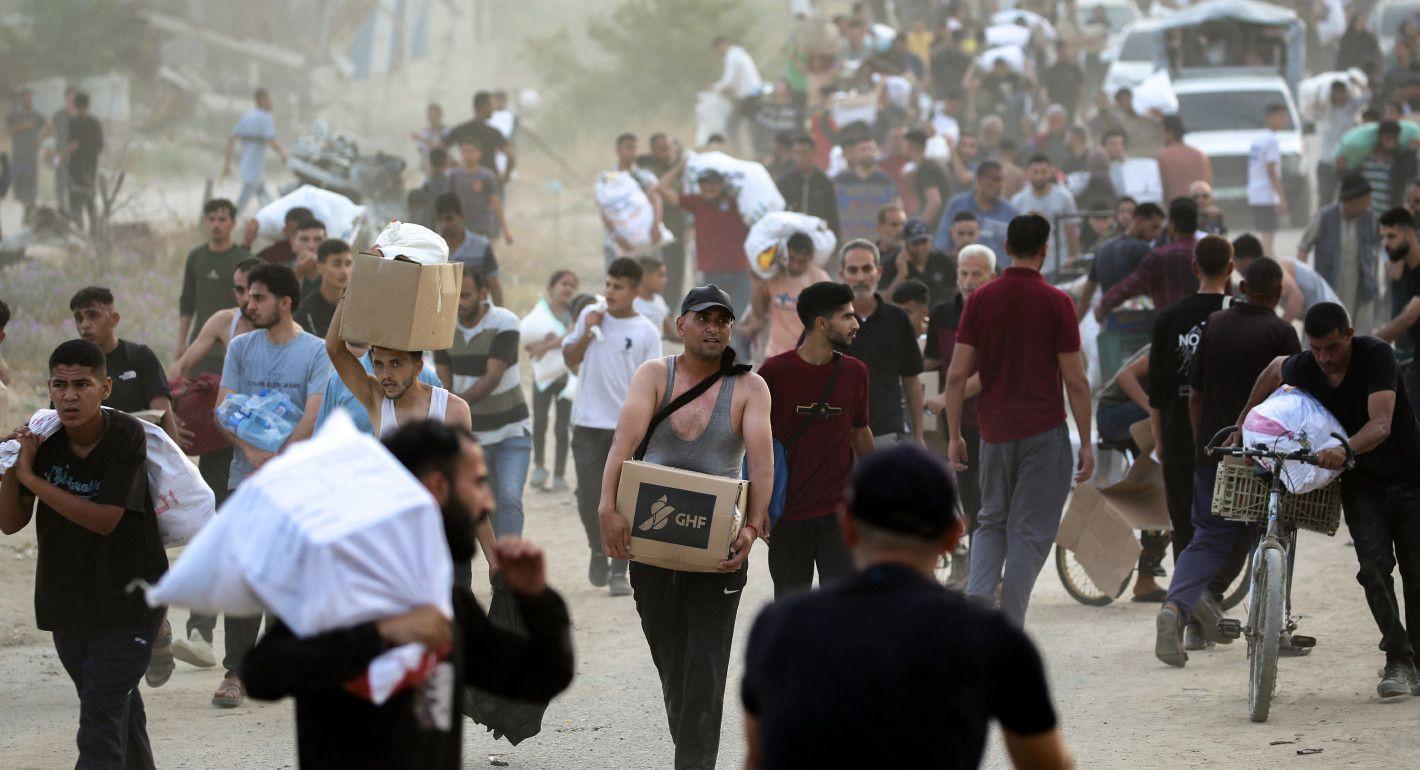
- Aid access: Intermittent openings and inspection backlogs at crossings; convoy pacing shaped by security windows and fuel availability.
- Civilian impact: Displacement flows shift with evacuation advisories and localized hostilities; essential services remain under sustained strain.
- Health system: Hospitals operate amid power and supplies pressure; medical evacuations hinge on coordinated time windows.
- Diplomacy and security: Talks over pauses and exchanges recur; escalation risks track incidents near border perimeters and maritime approaches.
- Information environment: Telecommunications outages complicate casualty consolidation; satellite cues and NGO field notes help bridge gaps.
To surface cadence rather than headlines, the matrix below groups recurring signals into daily windows and notes when at least two independent sources converge. Times refer to Gaza local time; statuses can change rapidly as confirmations roll in.
| Window (Local) | Signal Type | What sources converge on | Confidence |
|---|---|---|---|
| Early morning | Crossings status checks | Opening/closure notices and convoy staging updates | Multi‑source confirmed |
| Midday | Hospital operations | Fuel deliveries, ICU capacity alerts, triage overflow | Multi‑source with caveats |
| Late afternoon | Evacuation advisories | Route guidance and safe‑passage hour adjustments | Official + media concur |
| Evening | Ceasefire/pauses talks | Joint statements and mediation briefings | Mixed, pending confirmation |
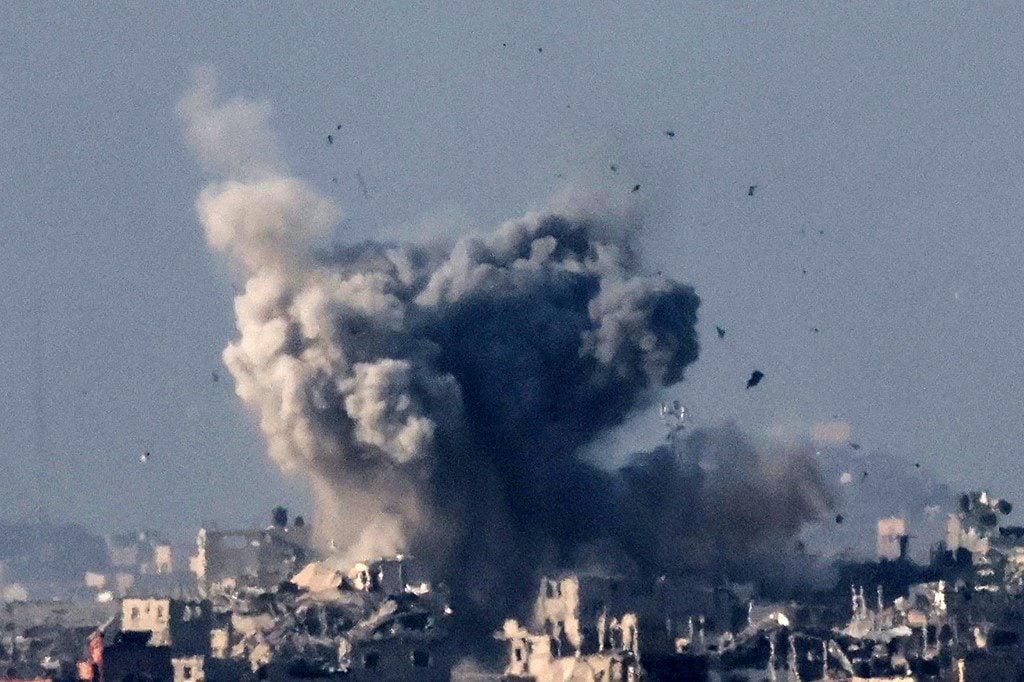
| Overnight | Hostilities intensity | Geolocated impacts after reporting lags clear | Delayed but corroborated |
Humanitarian impact and infrastructure status by the numbers
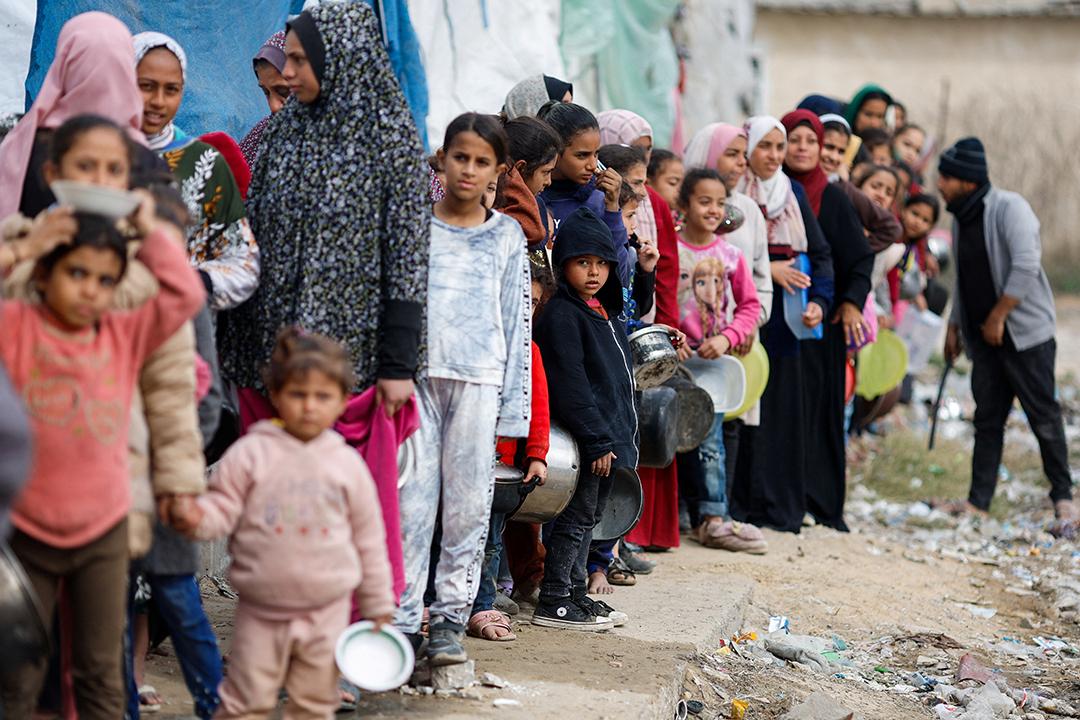
Lives are counted in minutes and meters when basic services falter, and the clearest picture emerges from small, concrete signals on the ground. Below are five pressure points frequently noted by field teams and local networks-snapshots of daily strain rather than exhaustive totals:
- Displacement: Repeated moves as areas shift from unsafe to uncertain; extended families split across shelters and private homes.
- Food access: Long queues for staples; fresh produce scarce; households adopting fewer, smaller meals to stretch supplies.
- Water & sanitation: Municipal lines and desalination repeatedly interrupted; trucking uneven; hygiene items in short supply.
- Health services: Clinics operating on backup power; emergency care prioritized over routine treatment; essential medicines running low.
- Protection & connectivity: Periodic communication blackouts complicate family tracing and aid coordination; safe-movement windows inconsistent.
Infrastructure tells the story behind every aid delivery-what can reach whom, and when. Figures vary by source and date, but the quick-look matrix below summarizes operational status indicators commonly tracked in the field:
| System | Status | Trend | Field note |
|---|---|---|---|
| Power grid | Largely offline | ↔ | Generators used where fuel is available |
| Water systems | Partial, intermittent | ↕ | Desalination and wells affected by outages |
| Health facilities | Overcapacity | ↑ | Triage prioritized; supply gaps persist |
| Roads & crossings | Restricted | ↔ | Access windows narrow and variable |
| Education facilities | Repurposed | ↔ | Serving as shelters and relief hubs |
Regional dynamics and historical context shaping the current phase
Today’s dynamics are layered-a web of security postures, border economics, and shifting alliances that extend well beyond Gaza’s perimeter. Egypt’s pivotal role at Rafah, Gulf-state mediation channels, and the Eastern Mediterranean’s energy calculus intersect with Israel’s deterrence doctrines and the Palestinian political divide. Meanwhile, humanitarian access and ceasefire diplomacy hinge on regional buy-in, where logistics (access routes, inspection regimes, aid flows) are as consequential as high-level summits. In this arena, messaging wars across satellite networks and social platforms shape public sentiment, nudging state responses and timelines as much as battlefield developments.
- Cross‑border linkages: Sinai security, Jordan’s stability concerns, and Lebanese front dynamics alter escalation thresholds.
- Energy chokepoints: EMED gas fields, shipping corridors, and insurance risk affect diplomatic urgency.
- Mediation architecture: Cairo, Doha, Ankara, Amman, and Washington convene overlapping channels with distinct leverage.
- Demographic pressures: Dense urban terrain and displacement patterns redefine ceasefire and aid design.
Longer arcs still frame the present. The post‑1967 map, the Oslo framework’s partial institutions, and the 2005 disengagement set legal and logistical precedents for movement, customs, and security coordination. The 2007 Palestinian split entrenched dual governance tracks, influencing blockade parameters and revenue flows. Subsequent rounds of conflict normalized “periodic escalation-temporary calm” cycles, while normalization drives-most recently the Abraham Accords-rebalanced regional priorities, placing crisis management alongside broader trade and security alignments.
| Era | Milestone | Regional Effect | Relevance Now |
|---|---|---|---|
| 1967-1993 | Post‑war lines | New security regimes | Rules of control and access |
| 1993-2005 | Oslo process | Interim institutions | Coordination frameworks |
| 2005-2007 | Disengagement | Border reconfiguration | Crossing protocols |
| 2007-2019 | Governance split | Divergent authorities | Blockade architecture |
| 2020-present | Normalization shifts | New coalitions | Broader bargaining space |
Actionable recommendations for policymakers humanitarian responders and media
As conditions evolve hour-by-hour, align decisions to verifiable needs, not headlines. Anchor choices in disaggregated, time-stamped data; anticipate constraints (fuel, connectivity, safe access) and pre-authorize contingency steps. Coordinate through existing clusters and local networks, publish clear redlines for civilian protection, and use multilingual risk communication that prioritizes lifesaving information over narrative framing.
- Policymakers: Guarantee predictable access windows and deconfliction for aid convoys; fast-track exemptions for fuel, medical oxygen, telecoms, and water-treatment inputs; fund multi-month flexible grants; and require transparent, public reporting on aid flow blockages and civilian impacts.
- Humanitarian responders: Operationalize a triage matrix that elevates WASH, trauma care, and disease surveillance; expand cash and voucher assistance where markets function; embed community feedback channels in Arabic; and publish open, anonymized indicators (bed occupancy, stockouts, fuel days remaining) to a shared dashboard.
- Media: Pair on-the-ground reporting with geolocated, time-verified visuals; protect identities of victims and staff; foreground service information (safe routes, clinic hours, boil-water notices); and disclose verification methods to reduce rumor velocity without amplifying harm.
Prioritize do-no-harm data practices: limit granular geodata that could endanger sites; obtain informed consent; and avoid imagery of identifiable children. Track a core indicator set (casualty trends, displacement density, water and power access, facility functionality, and telecom uptime) and publish update cadences so communities and responders can plan. When thresholds are crossed, trigger pre-agreed actions within hours, not days.
| Signal | Rapid Action | Lead |
|---|---|---|
| Fuel < 72h | Activate priority lists (hospitals, water pumps, bakeries) | Policymakers + Logistics Cluster |
| Crossing closures | Pre-clear reroutes; publish convoy ETAs and safe windows | Policymakers |
| Telecom blackout | Deploy satellite kits; shift to radio-based alerting | Responders |
| Clinic overload | Stand up mobile teams; expand MHPSS triage | Responders |
| Rumor spike | Issue bilingual fact cards; show verification steps | Media + RCCE |
In Retrospect
As this story continues to shift, we’ll keep aligning the page to what can be verified-updating figures, clarifying context, and noting what remains uncertain. Think of the context sections as a map and the datasets as coordinates: each helps with orientation, but neither replaces the terrain itself.
If you’re tracking developments, pay attention to timestamps, compare multiple sources, and treat preliminary numbers as provisional. Methodology notes and definitions are included to make comparisons fair and reproducible; please cite sources and dates if you reuse the data.
We’ll return to this file as new information emerges and patterns become clearer. Until then, let these updates, timelines, and references serve as a steady instrument-limited but reliable-amid a fast-moving narrative.